
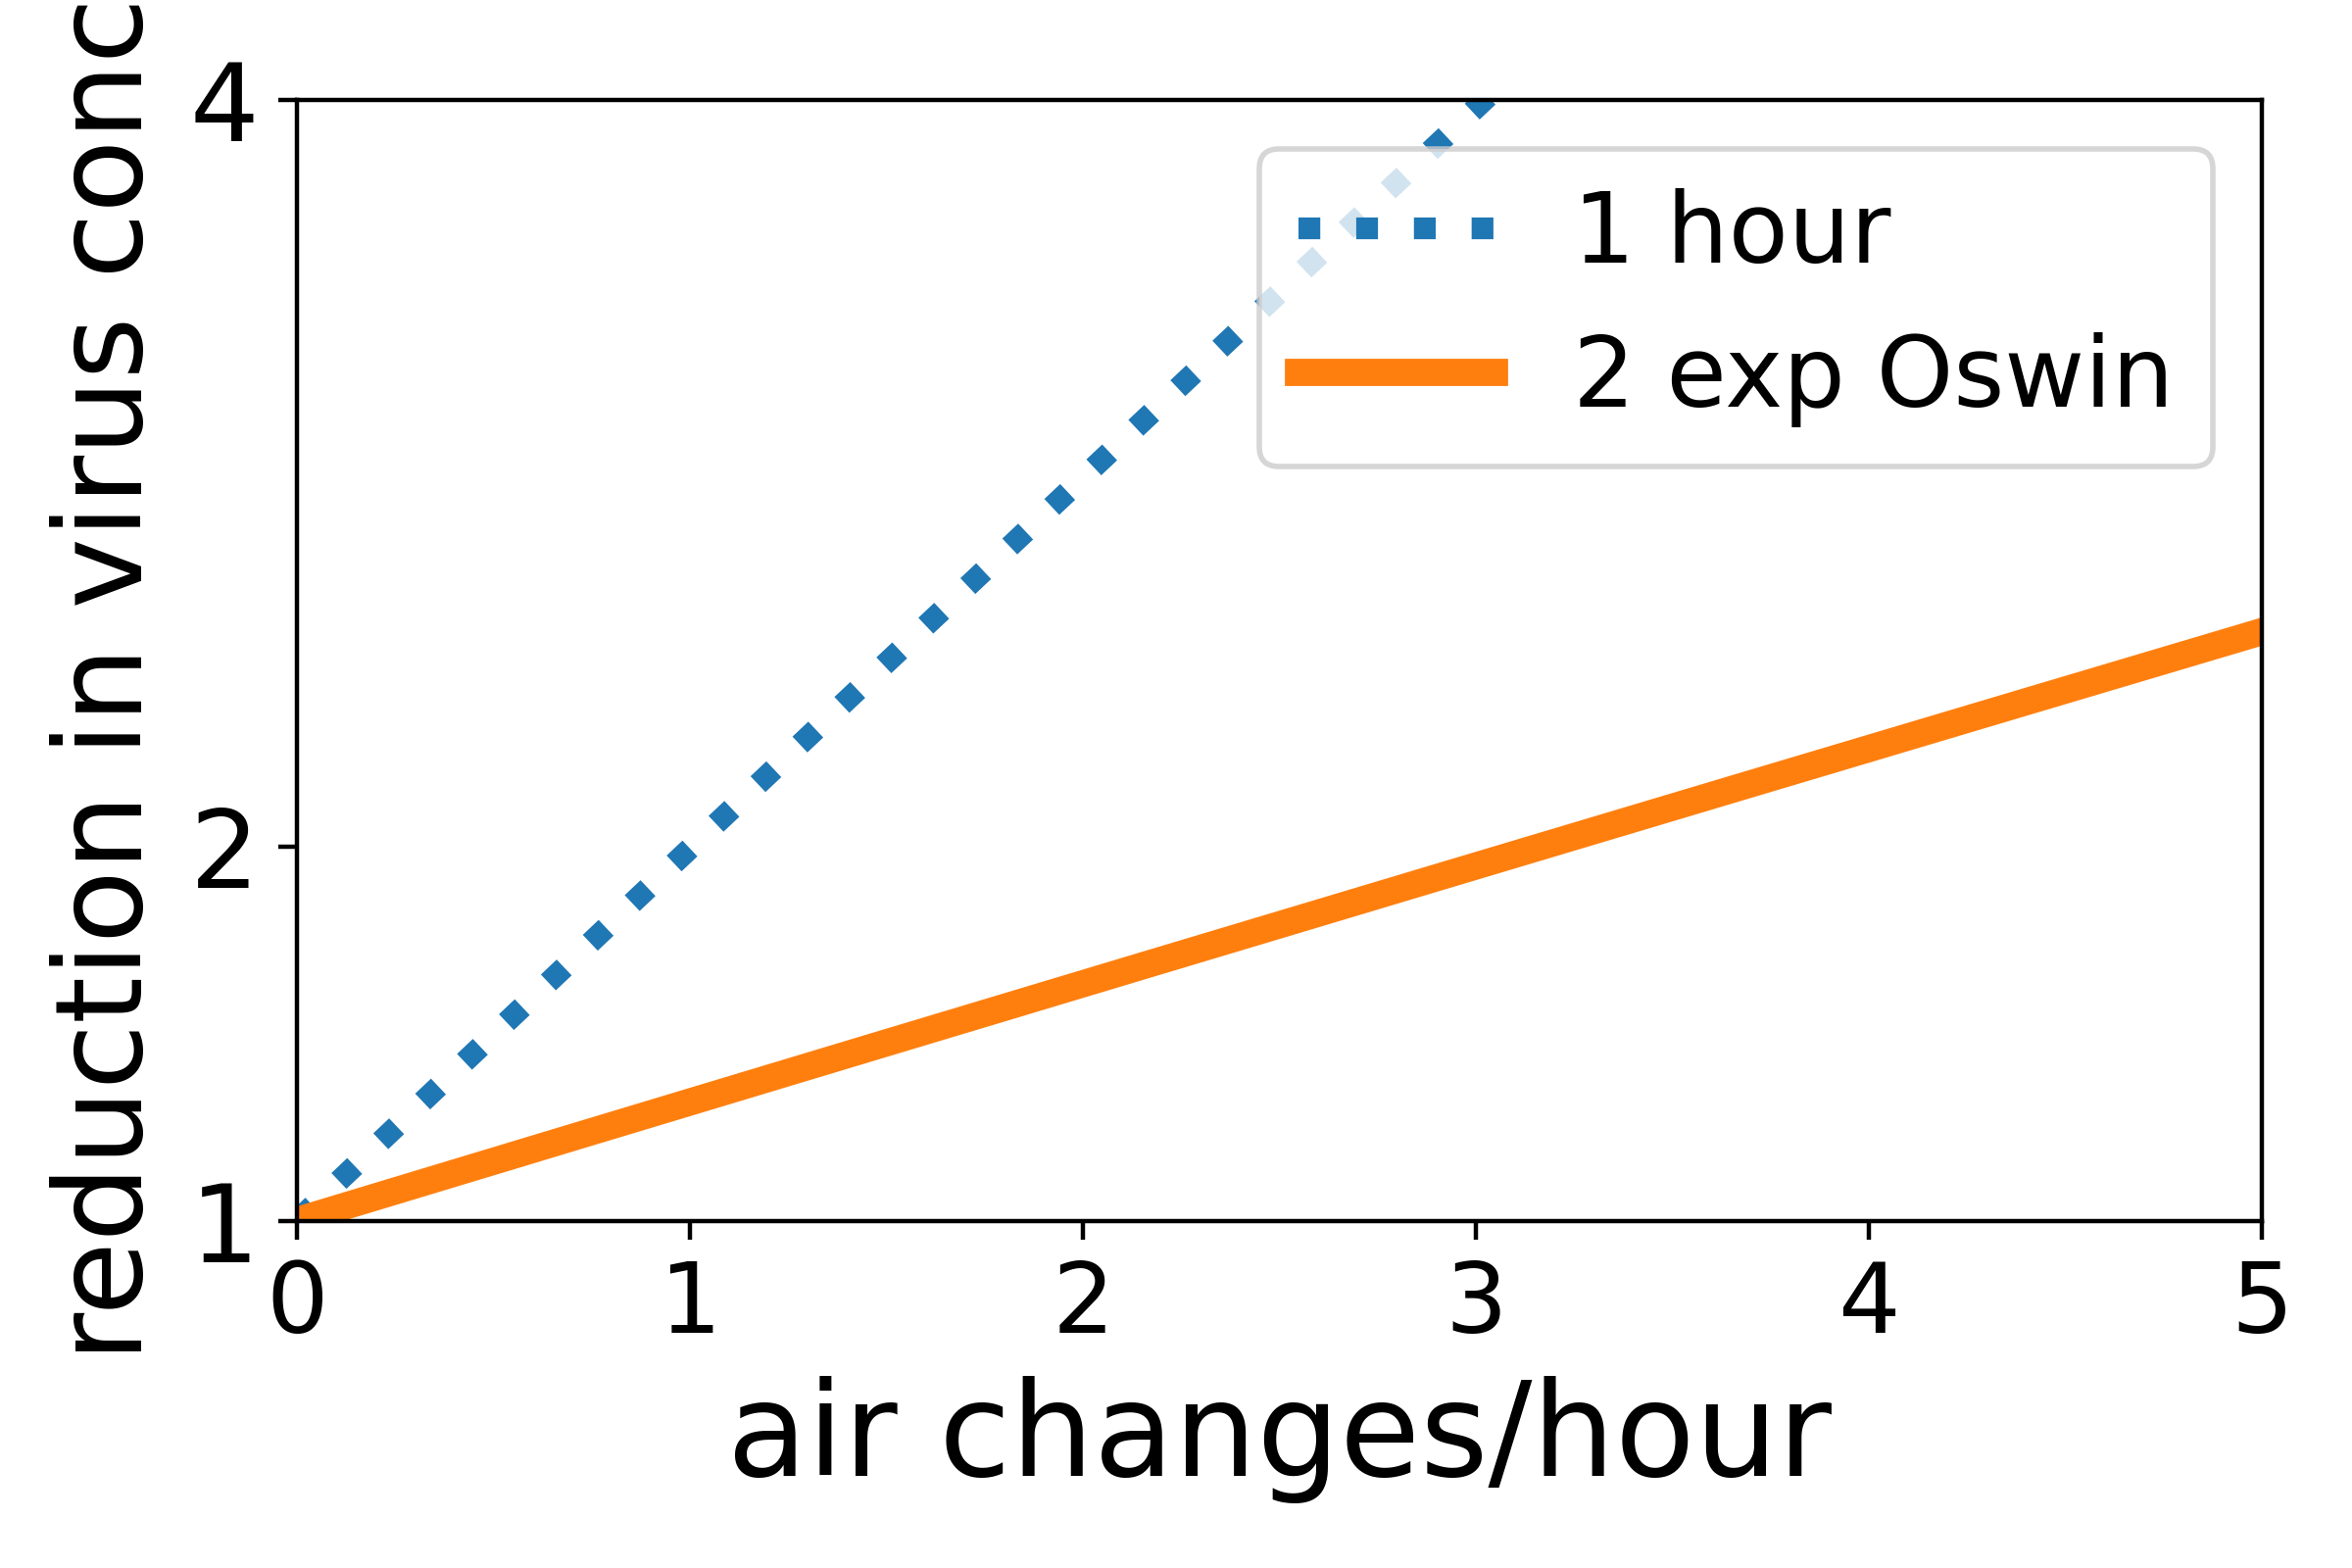
Quantifying the absolute value of the risk of catching COVID-19 is very hard, not least as it seems likely that some infected people may be breathing out a million times more virus, than others. But estimating changes in risk is a bit easier, eg a reduction in risk due to ventilating a room. If we make some assumptions (see below), we can estimate the reduction in exposure to the virus, due to ventilation turning over the air in a room. This is plotted above. The y-axis is the factor by which exposure is reduced, i.e., two means that the exposure is halved, and so on. The x-axis is the number of times an hour ventilation replaces the air in a room. So two means the air in a room is replaced by fresh air twice an hour. The solid orange line uses (a fit to) data of Oswin and workers on the how long SARS-CoV-2 survives in the air. The prediction is that turning the air over three times an hour approximately halves the exposure to virus.
This prediction is very sensitive to how long we think the virus survives in air. Ventilation at a rate r reduces transmission when r is about one over the lifetime of the virus in air, or larger. So if the lifetime of virus is about 20 minutes, then turning the air over every 20 minutes, i.e., three times per hour, halves exposure. But if the lifetime is an hour, then you only need to the turn the air over once per hour to get the same affect (at steady state). Alternatively, if the lifetime is an hour, then changing the air every 20 minutes (3 changes per hour) reduces the amount of virus present by a factor of four – see dashed blue line above.
Twenty minutes is roughly the lifetime of a virus that Oswin and coworkers find. But Oswin and coworkers’ data is limited by the difficulty of obtaining this data, and is at a relative humidity (RH) of 40%. It will be different at different humidities. We urgently need more data here, to understand quantitatively how good ventilation needs to be to drive down transmission of COVID-19, and of flu. For example, indoor air is less humid in winter than summer, if at lower RHs, viruses survive longer, then lower ventilation rates in winter may be enough. In the meantime, our best guess is that three air changes per hour is enough to reduce transmission.
More technical bit: The prediction up top relies on a lot of approximations/assumptions:
- This is for transmission across a room, i.e., not when you are close to the infected person, and especially talking to them.
- It assumes the air in the room is well mixed, i.e., that air currents rapidly mix the air in the room, and that ventilation replaces air in all parts of the room at the same rate. This and 1. are the same as made in the Wells-Riley model of airborne transmission.
- It ignores virus-containing droplets settling out of the air.
- It uses a fit to the virus-survival data of data of Oswin and workers. I fit two exponentials, and get time constants of 0.0014 (i.e., almost instantaneous decay) and 0.32 h, with the weight of the shorter exponential being 57% (and so longer one has weight 43%). Oswin et al‘s data is noisy (these are hard time-consuming experiments) so there are substantial uncertainties, and the droplets they study are not of mucus – the survival time for virus will be different in mucus. The data is at a relative humidity (RH) of 40%.
- The fit assumes that the amount of infectious virus decays as the sum of two exponentials. This is wrong, see earlier post. A viral particle in a drying mucus droplet is a complex thing, which may be destroyed in different ways and by processes that are cumulative. The standard exponential decay is appropriate for a single sudden process that occurs via a single pathway – but that is very unlikely to hold here.
