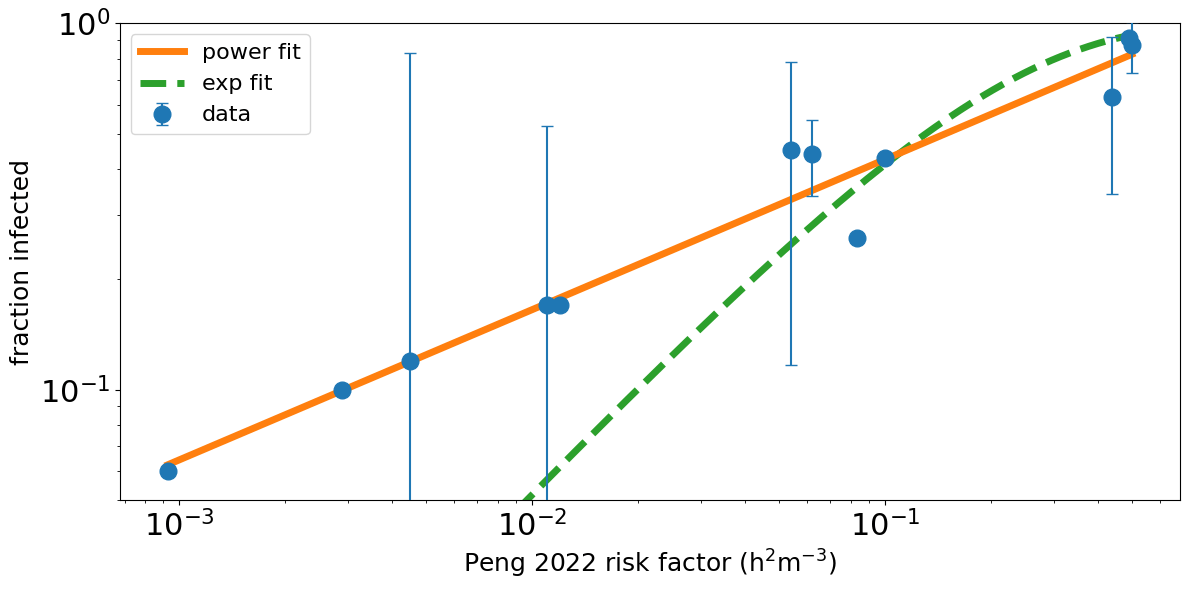
Peng and cowokers gathered together data on 12 (possibly not very representative) events where COVID was transmitted. For each event they estimated a relative infection risk factor Hr*. They then plotted the fraction of people infected (an estimate of the probability of infection), as a function of this estimated relative risk factor. They compared with the standard model for disease transmission – the Wells-Riley model (which is really just Poisson statistics). A fit of this model to their data is shown as the green dashed curve in the plot above. It is not a great fit**.
Fewer children sick with flu: Cheap at £15 per child per year
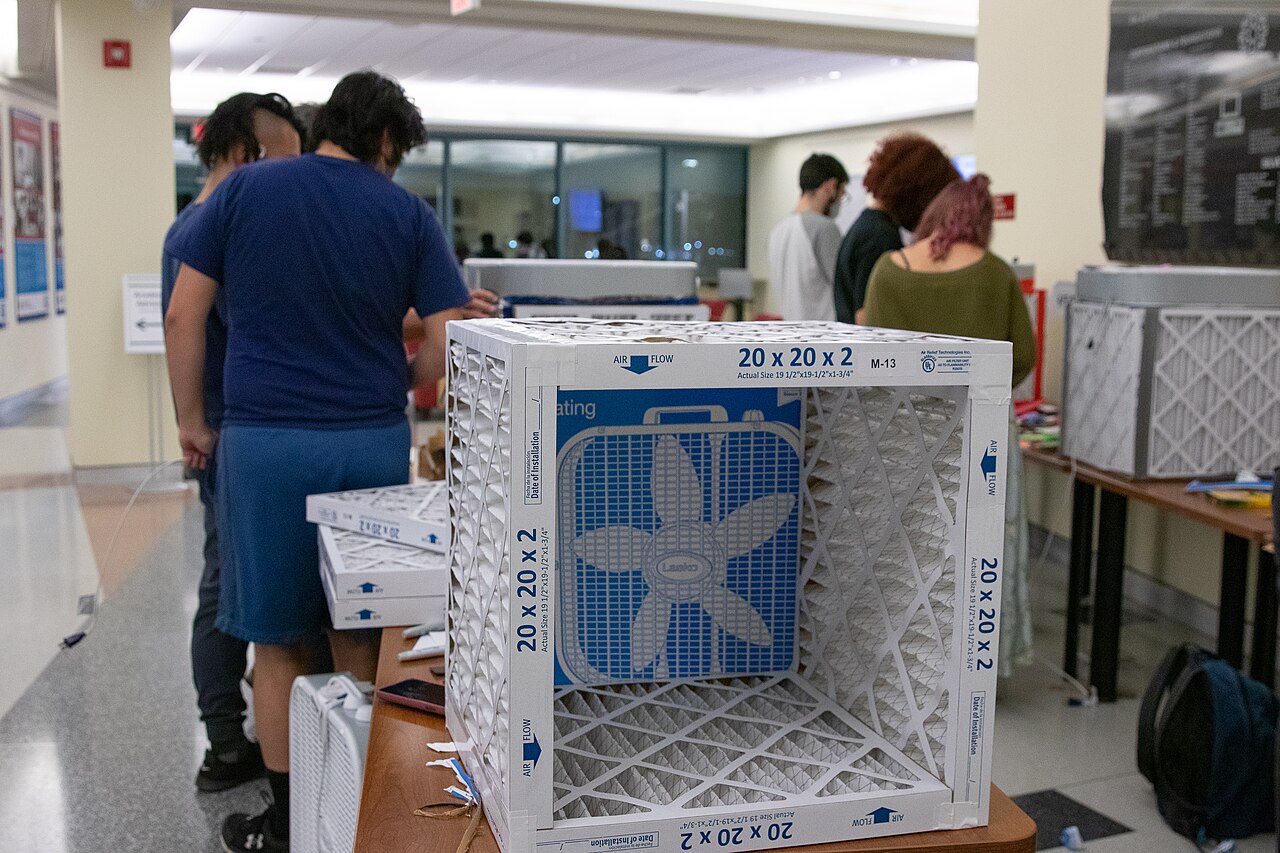
A standard air filtration system* costs very roughly £450 per year, so one in a classroom with 30 children costs £15 per child per year. The unit filters air such that it filters the classroom air around twice an hour. If we start with a perhaps typical classroom where the ventilation turns over the air twice an hour, then the filter doubles the air turnover rate and so should roughly halve the amount of aerosolised virus in the air. Using the formula in my previous blog post, this gives an estimated 20% reduction** in transmission of flu, COVID and other airborne diseases. For £15 per child per year.
Is a 40% reduction in flu transmission enough?
The Intercept fund starts with some strong statements:
Respiratory viruses kill 1 million people a year, cost us $600B annually, disrupt everyday life, and periodically threaten civilization.
and has some ambitious goals to improve the quality of the air we breathe in while indoors, the indoor air quality (IAQ):
Our goal is to catalyze the uptake of air cleaning technologies that safely reduce infectious aerosols by >75% and have a path to >50% uptake in transmission-relevant indoor spaces at low cost.
This level of ambition is, I guess, to be expected from a charity funded by the charitable arms of Anthropic and OpenAI, currently building trillion-dollar data centres*.
How Viruses Survive in Aerosol Droplets
Viruses like flu and SARS-CoV-2 (the cause of COVID) spread across the air in aerosol particles, often of order a micrometre across. To do this the virus needs to survive intact the rather violent process whereby a tiny droplet breaks off from a liquid. In this case the liquid mucus lining our throat and lungs. Violent here includes some rather fast, metres per second, flows as the droplet breaks off from the liquid and rounds up into a sphere. I estimated the shear stresses involved in this process in an earlier blog post as
where η is the viscosity (saliva is only a bit more viscous than water, at around 1 mPa s), Γ is the surface tension (about 0.05 N/m), ρ is the mass density (1000 kg/m3) and dD is the droplet diameter.
(Some) LLMs (with some help) can now do a toy simulation of a droplet in shear
One area where LLMs like OpenAI’s ChatGPT, Anthropic’s Claude etc are already making a splash, is coding. But scientific coding is tricky, even small errors can result in the code crashing or producing nonsense. Last year, a student working with me found that even for a relatively simple code, the results were often very wrong. But that was last year.
Training a toy neural net
I am no expert but as I understand it, a lot of LLMs like Anthropic’s Claude, and image generators like Stable Diffusion, are built on neural nets. And a lot of these neural nets are trained via backpropagation. I want to understand a little more about this, and maybe teach a simple example in my Python course – although this may be a little advanced for first year physicists. So first I need to teach myself a little about both how a neural net works and backpropagation works.
Breaking off droplets without breaking the virus inside the droplets

A respiratory virus like flu or SARS-CoV-2 (the cause of COVID-19) begins its journey to infect a new person by leaving the mucus-covered throat or lungs of an infected person, and becoming airborne in tiny droplets*. The infected person then breathes out these droplets containing their cargo of airborne infectious virus. This process of the virus leaving the liquid lining our lungs, throat and mouth, in small airborne droplets – an aerosol – is poorly understood. Viewing tiny, perhaps a micrometre across, droplets deep in our lungs, is impossible. But the formation of these aerosols obeys the same physics* as the formation of another aerosol – sea spray – shown in the image** above.
Diffusing towards a cute kitten

The image sequence above shows AI generation by a so-called diffusion model, specifically runwayml/stable-diffusion-v1-5 (obtained from Hugging Face). the Google Colab notebook that generated it is here. The final image – usually the only one you see – is on the far right. On the far left is an image that is near the start of the image-generation process. Image generation starts with just noise, along with the prompt to specify what you want the image to be: “a cute British short hair kitten, looking directly at you”. Then an iterative procedure is applied, in this case 48 times, to somehow subtract the noise to leave the kitten.
“Physics” as an LLM understands it
Large Language Models like OpenAI’s ChatGPT, Google’s Gemini, Anthropic’s Claude etc work with words but under their bonnets it is all maths. In particular the meaning of a word is encoded in a vector: a line of numbers, which allows the LLM to do vector maths on it to produce more words: its answer to your question.
How dangerous do masks get?
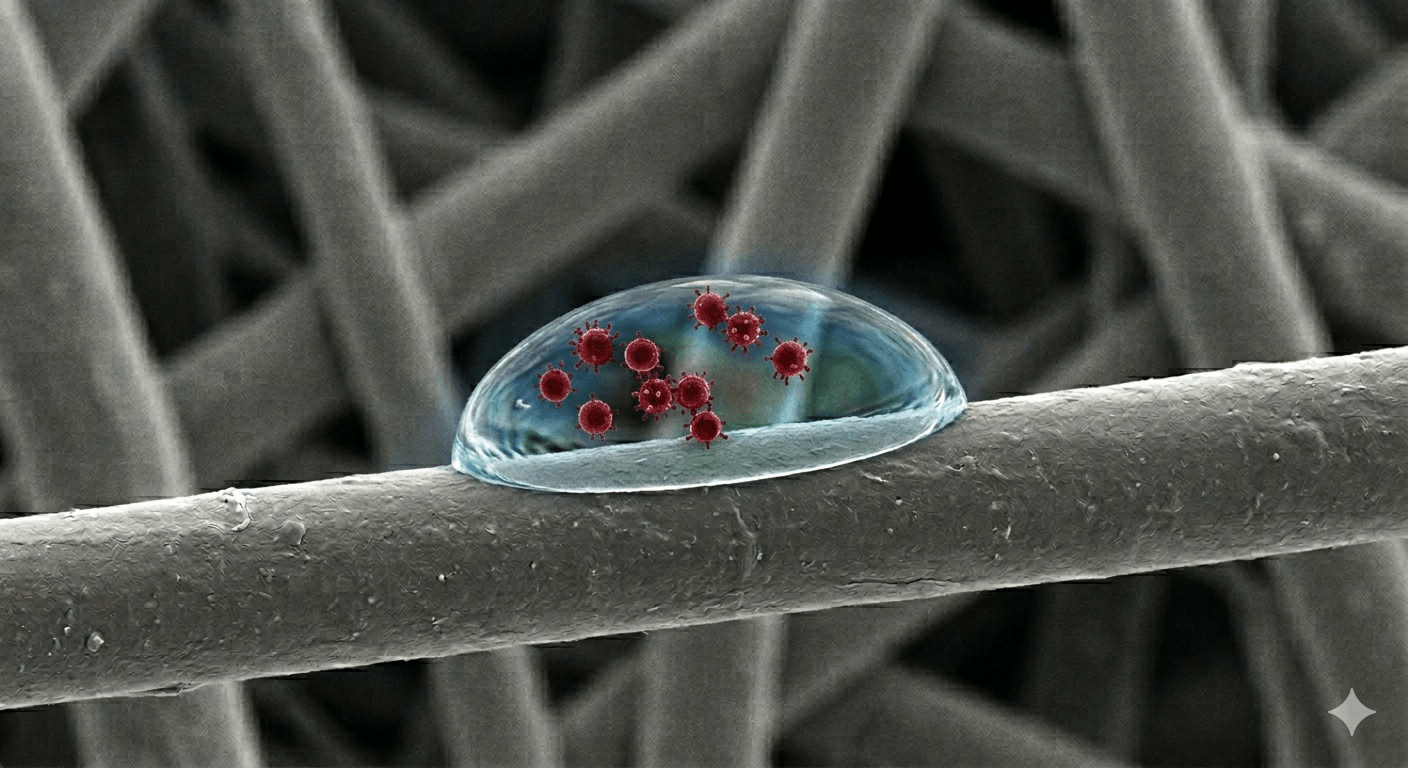
Masks exist to filter out harmful viruses and bacteria from the air the wearer is breathing. This protects the wearer, and if the mask wearer is infected, it protects others in the same room. Masks are air filters worn on the face and air filters are typically meshes of tiny fibres – illustrated in the rather shonky AI image above. They work by the virus-containing droplets in the air sticking to the fibres inside the filter, and so not going through the mask.
But then what happens to the virus-containing droplets stuck to fibres inside the filter material? There is understandable concern that the mask could be contaminated by these droplets, and that perhaps later infectious virus could be dislodged from the mask and go on to infect someone.
