This week, apart from the usual teaching and research, I both attended the Department’s annual Lewis Elton lecture, and read a blog post that takes a swipe at Excel. The lecture was given by Prof Adam Reiss (Johns Hopkins) who shared the 2011 Nobel prize in physics with Saul Perlmutter and Brian Schmidt, for showing that the expansion of the universe appears to be accelerating. This surprised a lot of people but appears to be true, not only is the Universe continually getting bigger and bigger but the rate at which it is doing so, is also increasing. This surprise won the Nobel prize.
Evidence that masks work in practice, especially if they are the good ones: the N95/KN95/FFP2s
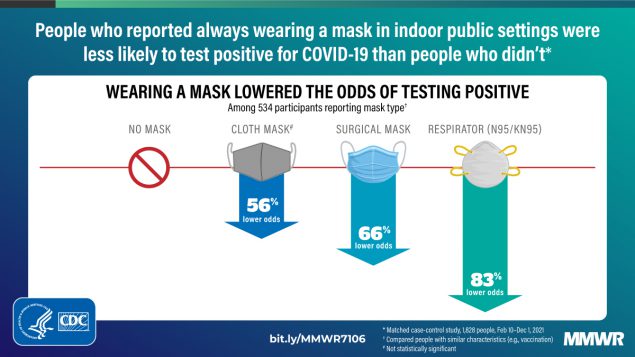
Above is a figure from a recent study published by the American government’s CDC (Centers for Disease Control and Prevention)*. Essentially, Andreko and coworkers studied two populations in California: one of 600 people who had just tested positive for COVID-19, and one of 1,100 who had not. They asked both sets of people about mask wearing while in public settings indoors (i.e., shops, workplaces, etc). Then they got the risk reduction from the numbers of mask wearers in the two populations. The idea being that if masks work you would expect a higher fraction of the 1,100 who don’t have COVD-19 to wear masks, than the 600 people who do. The way to read the figure is that they estimate that wearing an N95/KN95 (similar to FFP2, KF94, …) while indoors reduces your risk of catching COVID-19 by 83%.
Why does flu arrive in the autumn?

Above is a plot of deaths of children from flu in the USA, from 2017 to 2020. The data is from the USA’s CDC. I think the data in the UK will be similar, although the numbers will be lower as we have about a fifth the population of the USA. I just want to make three observations about this data.
Is NHS infection control misrepresenting the HSE, when it comes to masks?
Google recommended to me this article in Pulse: a publication for GPs. It made me wince quite a bit. A representative of the UK’s “NHS England national infection prevention and control team” was suggesting GPs and others wear surgical masks. The evidence is that FFP2s would be better, offer more protection. I was particularly struck by:
However, she [a “NHS England national infection prevention and control team member”] added that the UK Health and Safety Executive recommends healthcare professionals ‘should not use’ FFP2 masks and that ‘the only requirement to use them’ would be ‘if you couldn’t get FFP3’.
GPs should not routinely use FFP2 as surgical mask gives ‘very good protection’, Pulse, 19th Jan 2022
That is kind of true, the UK’s Health and Safety Executive says:
HSE’s current stance is that where there is a respiratory risk of infection use of FFP3 devices represents best practice, and where these are not available then FFP2 may be an acceptable, pragmatic compromise.
Evaluating the protection afforded by surgical masks against influenza bioaerosols (Research Report 619), Prepared by the Health and Safety Laboratory for the Health and Safety Executive 2008
So, the HSE (who are people in the UK government who understand masks – unlike apparently NHS infection prevention and control) are indeed advising against FFP2s when there is significant risk of infection. They are advising upgrading to a better mask. FFP3s are better than FFP2s. They are not recommending downgrading to the much worse surgical masks, as NHS national infection prevention and control is doing. Odd.
Teaching half the class
Last semester, teaching was on average about halfway back to normal, but for computing it was almost normal, apart from the masks, which weren’t a big deal. I think it went well. I introduced a little warm-up introductory informal lecture at the beginning. This was maybe 10 to at most 30 minutes in the computing lab, introducing and motivating that week’s Python Jupter notebook. Students voted with their feet and despite it being at 9 am attendance was good. I will do it again next year.
Many medics including Sir Chris Whitty don’t seem to understand how masks work
Today there was a COVID-19 press conference, with the Prime Minister Boris Johnson, and Sirs Chris Whitty and Patrick Valance. It is on YouTube. At about 38 minutes LBC’s Ben Kentish asked a couple of questions. Sir Chris Whitty gave what sounded to me like an excellent answer on vaccines, clear, authoritative, from the heart, and useful. Impressive. He was also also asked about some healthcare workers not getting FFP3 masks. Maybe the question was a little vague but the answer was certainly vague and he did imply that there was a debate about where an FFP3 was useful and where they are not.
How long does SARS-CoV-2 survive outside the body?
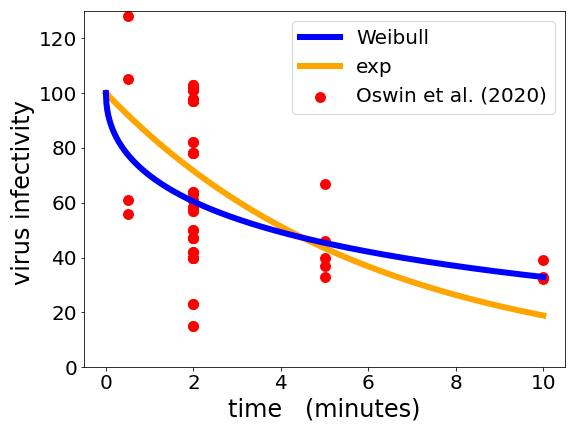
It may not be obvious that there is a connection between the air-conditioning units of Boeing airliners, and the survival of viruses, but there is. In the 1960s, an engineer called Proschan, while working for Boeing, was studying the failure statistics of the air-conditioning units in airliners. He was a pioneer of what is often called survival analysis – the branch of statistics that deals with failure/death. The same statistics applies both to failure of a machine, or death of an organism — and to the demise of a virus, which is perhaps somewhere between a machine and an organism.
Something surgical masks can do: stop you spraying someone with your bugs
Many people are wearing surgical masks, even though SARS-CoV-2 is airborne and so a better fitting mask, eg FFP2, would offer a lot more protection. But surgical, and cloth, masks are not useless, if you are infected they are good at stopping you breathing virus-laden particles directly onto to anyone you are talking directly at, and are close to. This is nicely illustrated in a recent work by Bourrianne and coworkers. The basic point is simple, we need to breathe in and out, about once every couple of seconds. When we breathe out we push out a litre or two of air in about a second. This goes through some combination of our nostrils, and a typically mostly closed mouth. This is quite a small area, perhaps a few square centimetres. Basic geometry says that to expel 1 litre through holes say 10 cm2 in area, you need a speed of 1 m/s. This is quite fast and results in a cone of air shooting out from your mouth/nose towards anyone you are facing*. The cone rapidly dissipates in the room air but still you are imparting momentum to your breath which carries it and any nasties it may be carrying towards anyone you are facing.
Open the windows, and let the carbon dioxide and virus out
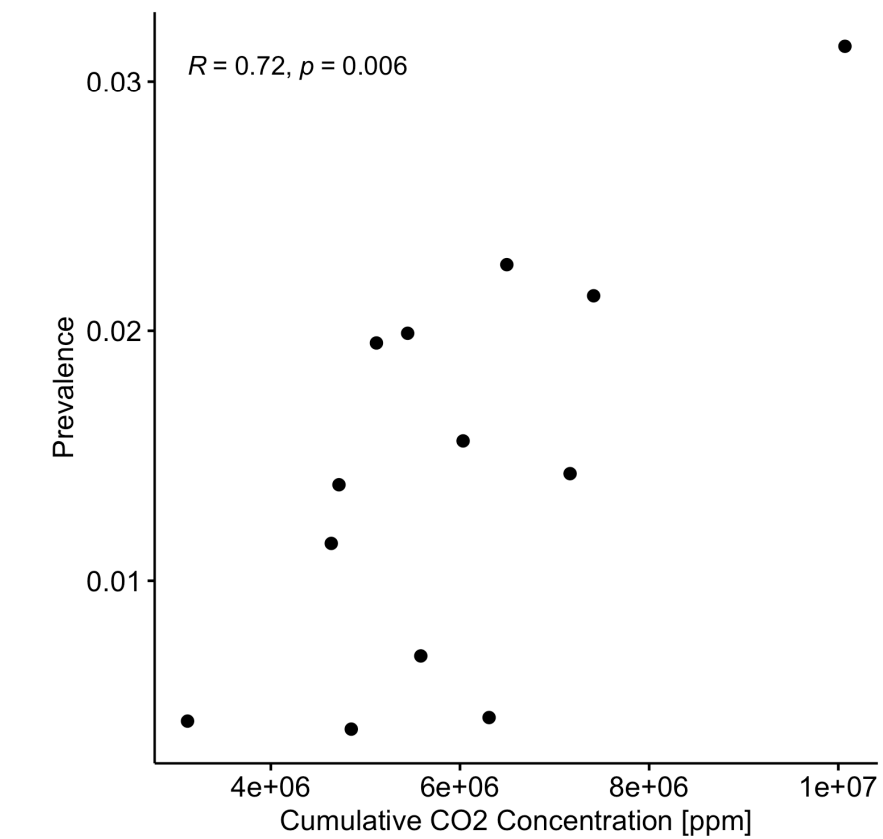
Above is a plot of prevalence of COVID-19 in children versus the concentration of carbon dioxide (CO2) in their classrooms. Prevalence is defined as being number of children who test positive for COVID-19 per 100, so 0.01 means one in 10,000 children has COVID-19. Cumulative CO2 concentration is obtained by integrating CO2 concentration over something like a school day, I think. The data is from a study by Empa (part of the Swiss university ETH), of classrooms in Graubünden, a canton of Switzerland. As they say, this is very preliminary, but although of course the data is noisy there does seem to be a trend. The R in the plot is Pearson’s correlation coefficient, and a value of 0.72 suggests a significant correlation between the amount of CO2 in the air children are breathing in classrooms, and how many are becoming infected with COVID-19.
Beards and mask wearing: Dos and don’ts

Back in the carefree year 2017, the USA Centers for Disease Control (CDC) produced the above guidance for healthcare workers who needed to wear masks for work, but favoured facial hear. It was motivated by Movember. The green ticks mean that the style of facial hair is compatible with wearing a fit-tested mask, the red crosses indicates that the style is not allowed, and those healthcare workers who need to mask-up at work will need to get the razor out. Most moustaches are allowed but almost all beards are banned as there is then facial hair where the mask has to fit tightly to the skin (see top left of image) to get a good seal and prevent air leaking around the edges.
