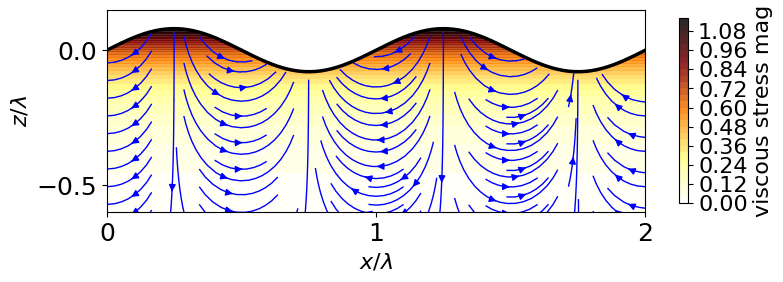
As aerosol droplets form, there are fast flows of liquid as it rearranges itself into the spherical droplet. These fluid flows generate viscous stresses (forces), in fact these forces are the ones that slow down the flow to form a finally at rest liquid droplet. The viscous forces are quite complex, they vary in relatively complicated ways in both space and time. And viscous stress is a relatively complex beast, it is a tensor not a scalar or a vector, so in 3D this is 6 numbers*. So perhaps it is best to start with a simpler system than a forming droplet. Maybe the simplest system is a liquid whose surface is moving due to being perturbed by a simple sine wave. A surface perturbed by a sine wave along the x axis is shown above**, with the streamlines of the resulting liquid flows shown in blue.
The system is just relaxing to a flat smooth surface at a rate given by the competition between the driving force of surface tension smoothing out the wave to reduce its surface area, and the opposition of the viscosity of the liquid. So the surface of the liquid obeys
Here a0 is the initial amplitude of the perturbation of the surface, k is the wavevector of the perturbation, which is along x. The relaxation rate scales with the liquid’s surface tension γ and inversely with the liquid’s viscosity η. It is also proportional to the wavevector k, so short wavelength waves decay faster.
Beneath the surface the flow velocities decay exponentially into the bulk of the liquid, i.e., the x and z components are
Note that the z component of the velocity is largest beneath the peaks and troughs of the wave. As expected the z component of the velocity is negative beneath the peaks – as liquid flows down to reduce the peak – and positive beneath the troughs – as liquid flows up to fill in the trough. The x components are out of phase with the z component, and so zero at the peaks and troughs and largest midway between a peak and trough. This results in the half circles of rotating flows shown by the blue streamlines in the plot above.
So, what about the viscous stresses? The shading above shows the magnitude of the viscous stress***. Note that this magnitude does not depend on x, only on z the distance from the interface. And as expected it is largest at the interface, and then decays (exponentially) as the distance from the surface increases and you move deeper into the liquid****.
But as stress is a tensor not a single number then the plot at the top is not unique. For example, you can pick not the stress magnitude but the τxx component of the stress tensor and get:
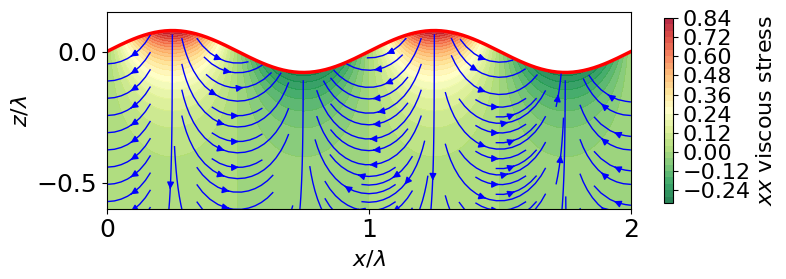
where the shading is now τxx. τxx is the viscous stress along the x axis due to the flow velocity varying along the same x axis. Viscous stresses are due to variations in the velocity: if the velocity is constant there are no viscous stresses. Basically τxx is large and positive if there is strong stretching along the x axis, i.e., if as you move along the x axis, the speed along this axis increases. It is large and negative when the fluid is being squashed along the x axis*****.
Note that again the largest stresses are at and near the interface, but now it is clear that near peaks the liquid is being stretched along x while near the troughs it is being compressed.
The τxz component of the viscous stress tensor has a different distribution in the liquid:
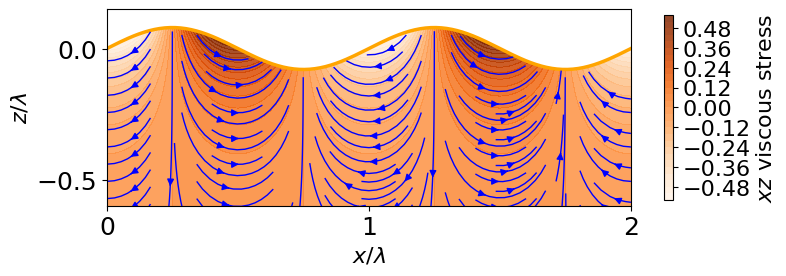
which is out of phase with the τxx component******. Now the largest magnitudes are midway between the peaks and the troughs. The τxz component is I think typically called shear. It depends on how fast the x component of the velocity varies along the z (not x) axis, and vice versa. So, for example, if you have a layer of liquid moving rapidly along the x axis just above (i.e., above along z) a layer moving much more slowly, you have a lot of shear, and τxz is large.
So, there a couple of different types of viscous stress, and these have different distributions along the wave, but all decay as you move away from the surface. If you are thinking of whether these viscous stresses could damage a delicate virus, then clearly the danger is highest near the surface, but whether the peaks, troughs or parts in between are most dangerous, depends on what type of stress, shear or elongational, is most dangerous to a virus.
* Tensor is symmetric so it is 6 not 9 numbers.
** All plots are done by this Google Colab notebook.
*** If the components of the stress tensor are τxx etc, the magnitude is defined by
**** The maximum value of the viscous stress is:
so basically the surface tension times the amplitude of the wave and the square of the wavevector. The decay is exp(kz) i.e., with decay length that is the wavelength over 2 pi.
***** The liquid is assumed incompressible so whenever it is compressed or stretched along one axis, then compensating flows come in or out along the other axes to compensate.
****** The viscous stress magnitude combines these two components that are out of phase along x to get a a stress magnitude that does not depend on x.


