At the moment two ships are in the news for infectious disease outbreaks, the MV Hondius for an outbreak of the Andes strain of hantavirus (ANDV) and the Ambition for a norovirus outbreak. This outbreak on the Handius has resulted in three deaths to date. These are just two of a long line of plague ships, including the Diamond Princess during the early stages of the COVID pandemic. Viewed from one way, this is perhaps unsurprising: large cruise ships squeeze several thousand passengers and crew into a confined space that looks a perfect place to transmit disease from one person to another. But I am bit surprised both that the companies that run these ships don’t seem to be doing anything to stop these regular bursts of bad PR, and that potential passengers are not put off by the risk of boarding a potential plague ship.
The pattern of transmission of ANDV is very different, from that of, for example, flu or COVID. As it is rare there is I think only one detailed study of transmission of this virus, an excellent study by Martínez and coworkers.
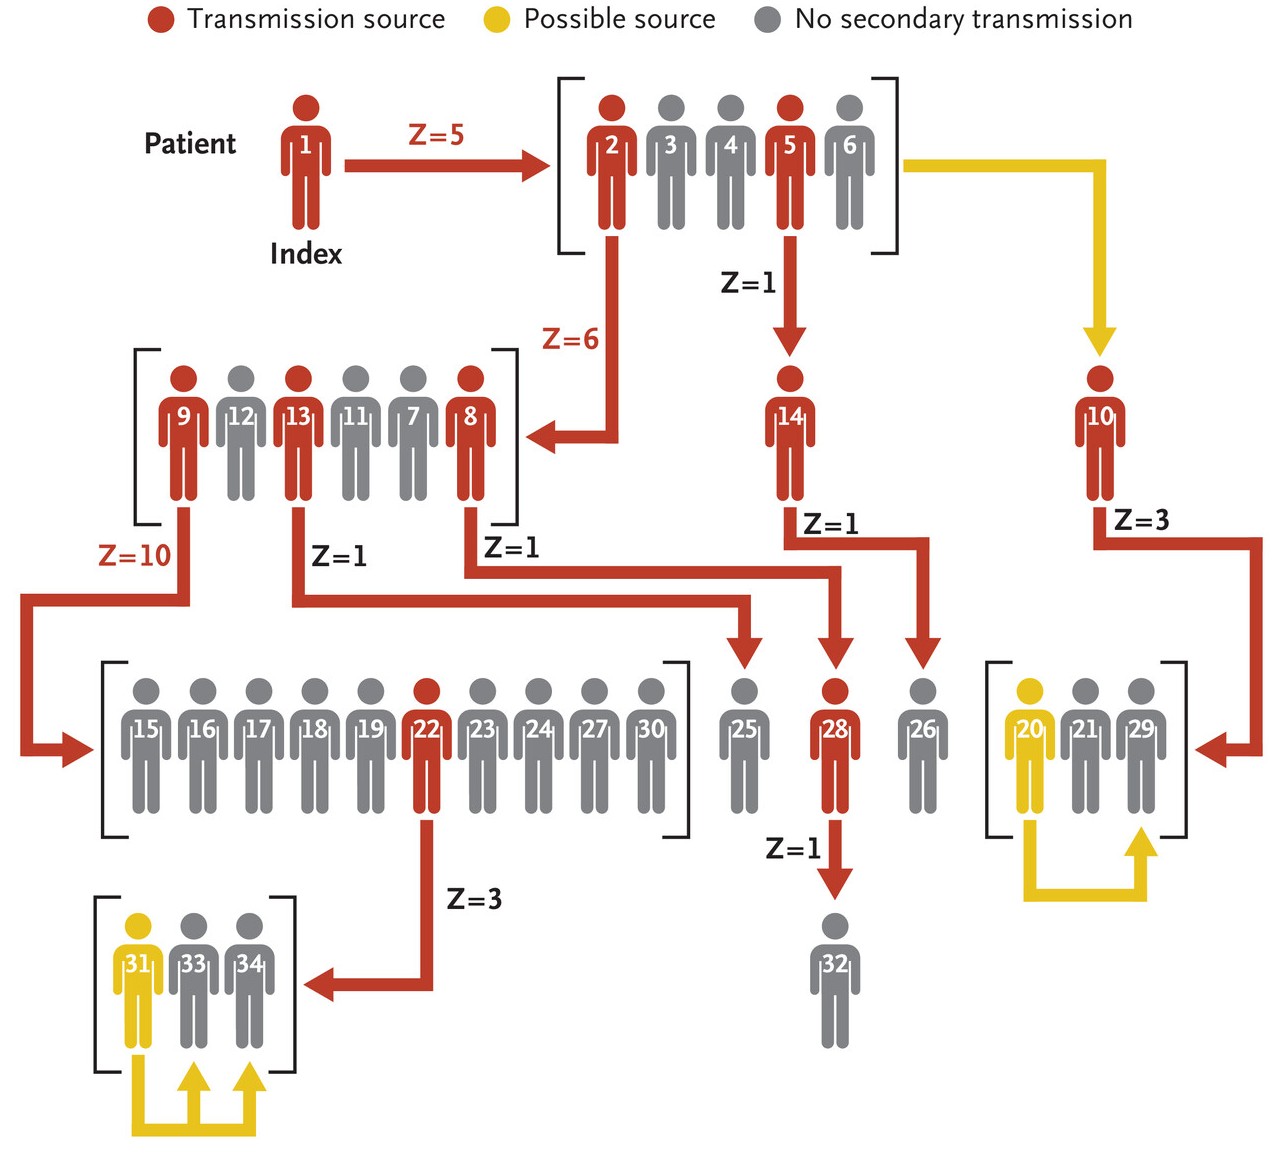
The image at the top is from this work: “Super-Spreaders” and Person-to-Person Transmission of Andes Virus in Argentina, by Martínez and coworkers (New England Journal of Medicine 2020). This virus infects rodents but it does occasionally cross-over to humans, including to I think one half of the Dutch couple on the cruise ship who has died. Above, the study of Martínez and coworkers of an outbreak in Argentina in 2018 suggests that the case labelled “Index” caught the disease from rodents – possibly by the unattractive mechanism of inhaling dust (aerosol) containing rodent poo from infected rodents that had the virus.
Then the Index case infected 5 others, one of whom infected 6 others, while another one infected one other person, while the other 3 did not infect any others. One of these infected 10 others, and so on, but the outbreak was then contained and it died out. So the Index case was likely rodent-to-human transmission, but the other 33 were infected by human-to-human transmission.
So in 2018 in Argentina it looks like one person was infected with the Andes strain of the hantavirus, then human-to-human transmission went on to infect 33 others. A year later in 2019, perhaps only one person* was infected with COVID-19 in Wuhan, China, and in the resulting pandemic it seems likely than more a billion were infected. Why the difference between 33 and a billion?
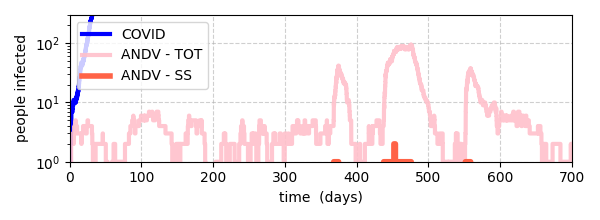
The basic reproduction number R0* of COVID in unvaccinated populations is well above one, perhaps around two. This means one infected person infects (on average) 2 others who infect 4 more, who infect 8 more, then 16, 32, etc. This is exponential growth and goes from 1, to 1 billion, in about 30 generations. This gives the blue curve below:
Note the log scale y axis, so the exponential growth is roughly a straight line (it is a bit noisy as all the results in the plot are the result of stochastic simulations). So much for a toy model of COVID***, what about ANDV?
Presumably the reproduction number R0 of ANDV is less than one, i.e., someone infected by a rodent goes to infect, on average, less than one other person, and so the outbreak dies out – no pandemic. But what about the superspreaders mentioned by Martínez and coworkers? One of the infected people went on to infect 10 others?
We can model this. We just assume that say, 1 in every 100 people infected is much much more infectious, i.e., this person does not have an R0 of less than one but of much larger than one. The results of calculations of a model with ‘normal’ infected people with R0 < 1 and superspreaders with an R0 > 1 are the red (superspreader) and pink (normal infected people) curves above. This is for a rather random set of parameters – not representative of any country/cruise ship – just for the purposes of illustration.
The number of infected people is dominated by the much more common non-superspreaders (pink curve). It fluctuates due to people being infected by rodents at some rather low rate but does not grow exponentially as the effective R0 is less than one. But occasionally rodents infect someone and they are a superspreader who is so infectious that they kick off a outbreak. For the parameter values I ran for, an superspreader-driven outbreak typically peaks at a bit less than 100 and then dies out. Note that there are 3 outbreaks, the 1st and 3rd driven by just one superspreader, while there are 2 superspreaders in the 2nd outbreak.
Because there is constant occasional person infected by a rodent, the disease does not go away but as the effective an R0 is less than one, there is no explosive growth. There is just a background of people being randomly infected by rodents, plus rarer much larger outbreaks when someone is infected and either they or someone they infect is a superspreader.
* Or possibly a few people, not sure we will ever know.
** It is worth bearing in mind the number of people an infected person infects depends on many factors, including how infectious the person is, i.e., is their body full of virus or is there much less virus in their system, and when they are infectious are they surrounded by other people, eg in a crowded cruise ship restaurant.
*** The transmission of infectious diseases is very complex, so any model of transmission is inevitably a great simplification. The statistician George Box’s famous quote: All models are wrong, but some are useful applies here. The model is implemented in this (very rough, sorry) Google Colab notebook.
