
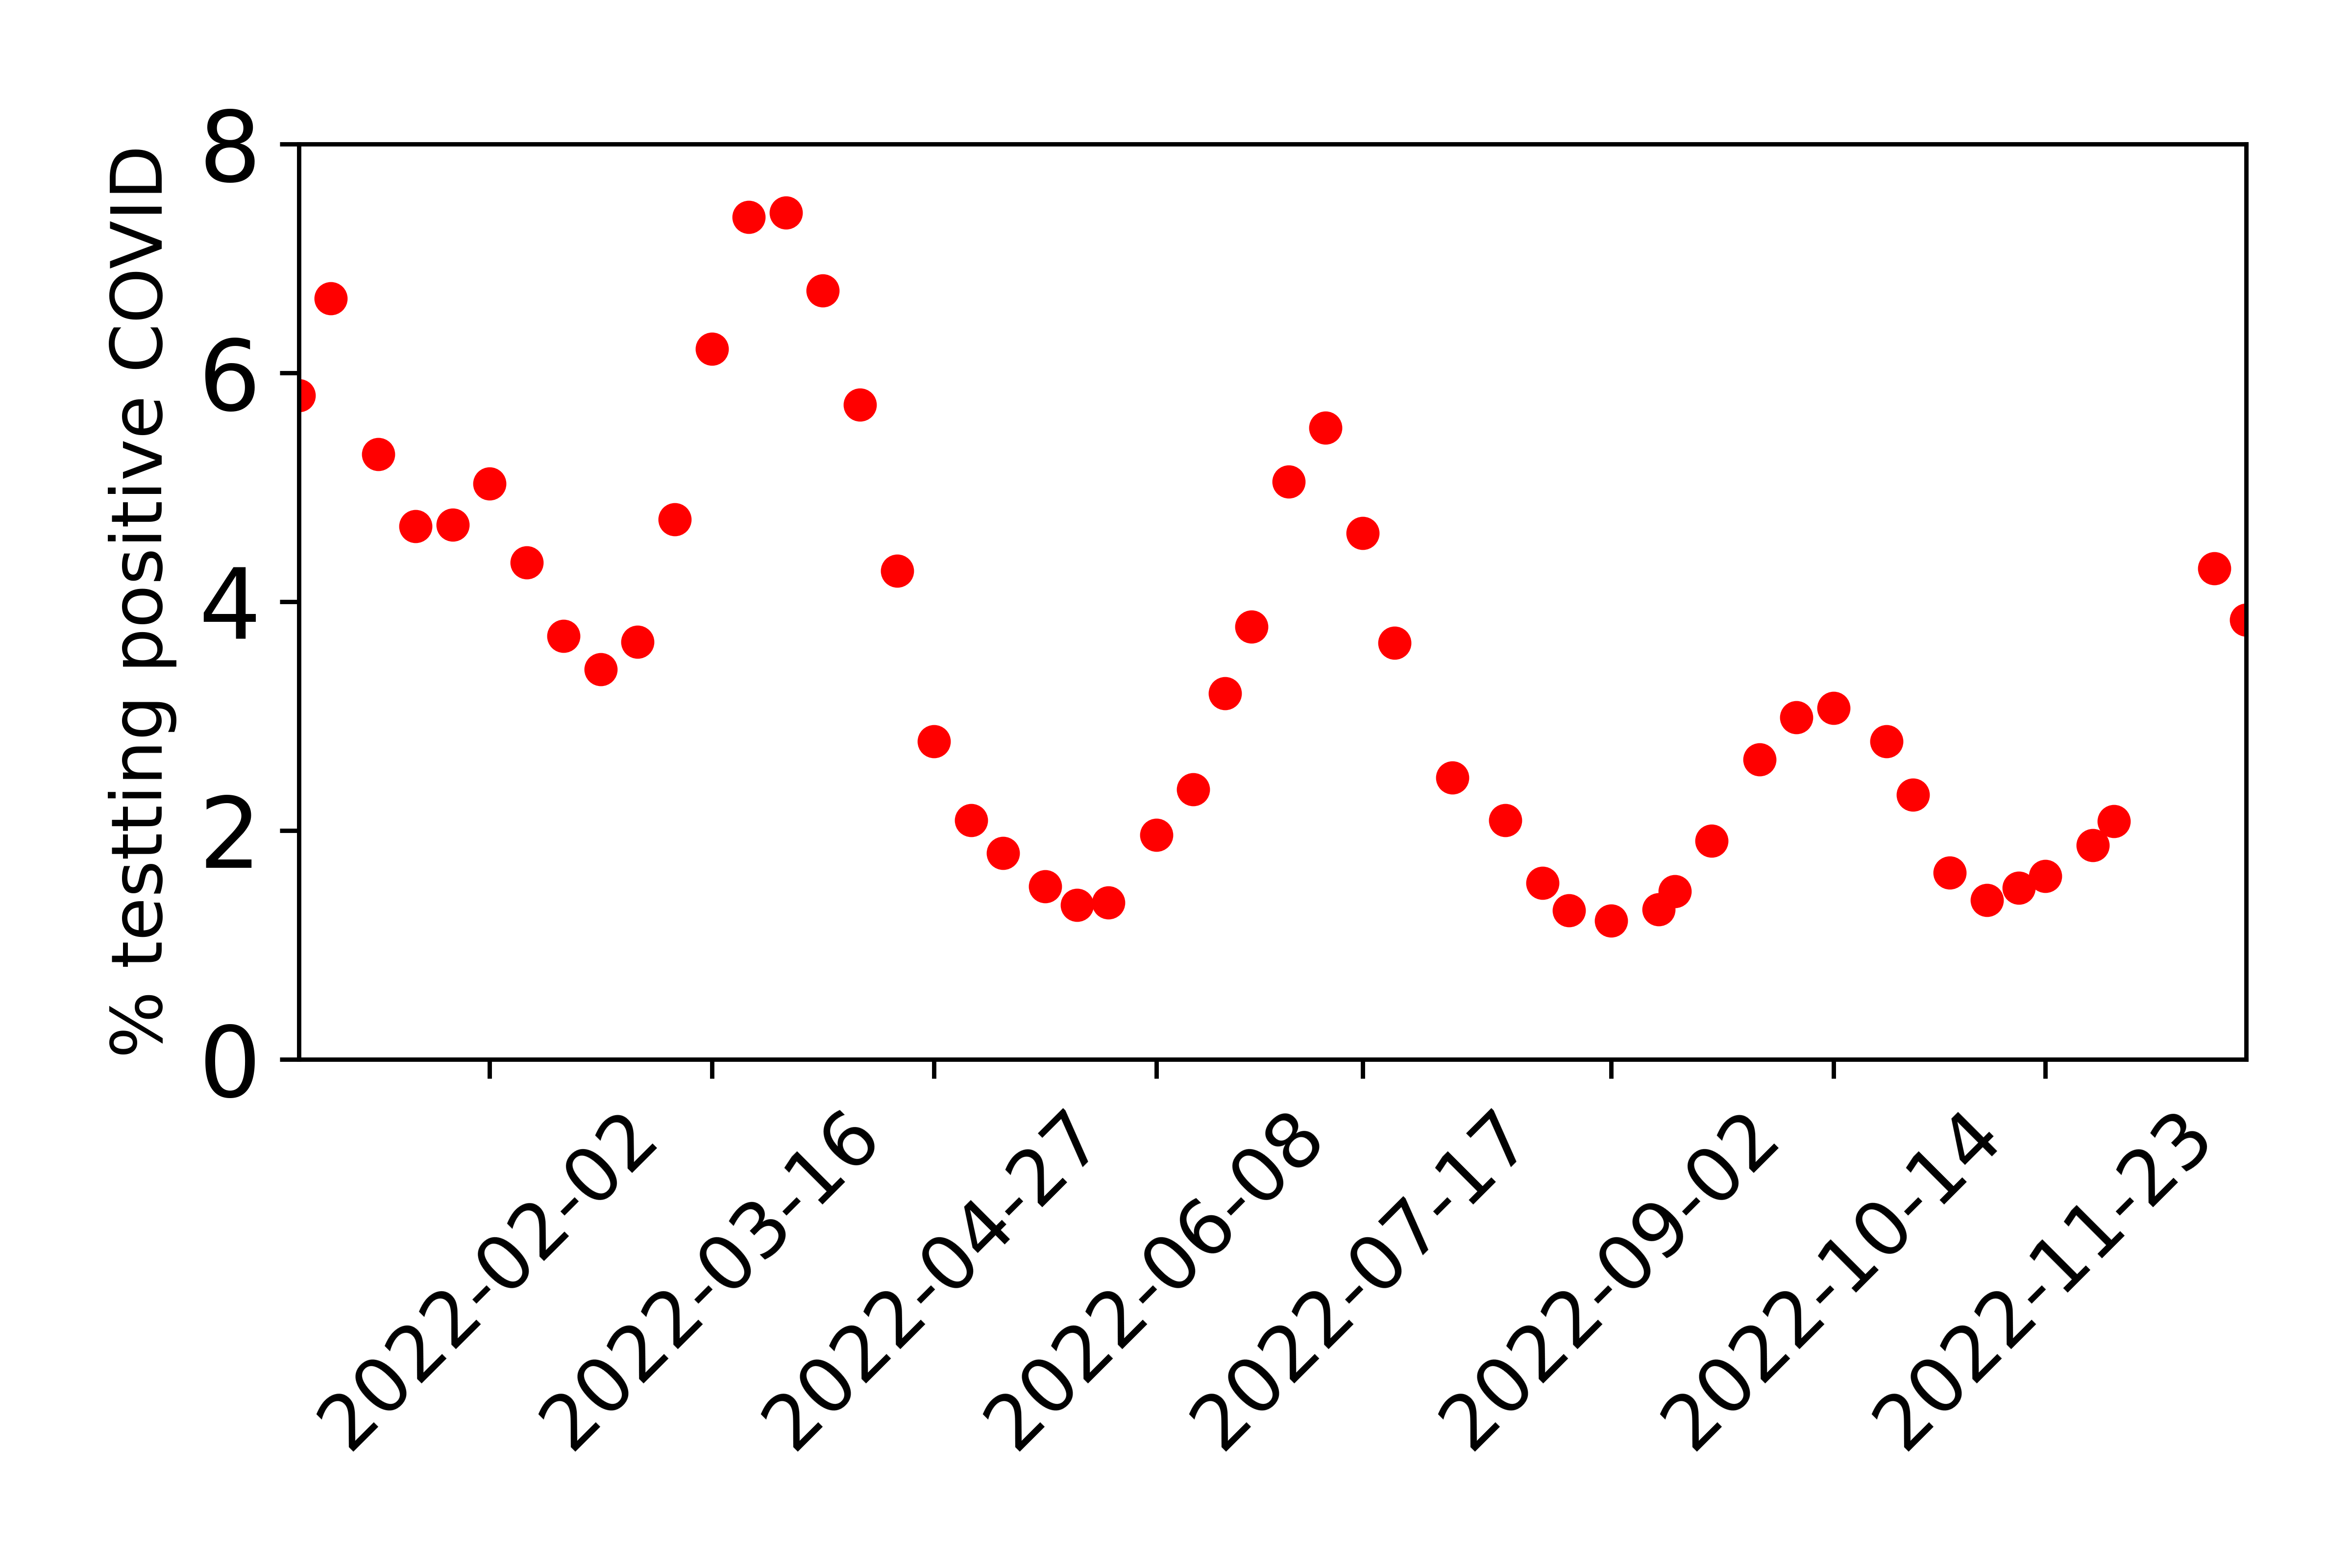
The title of this blog post kind of says it all, see the plot above. The plot is for the calendar year 2022 and for each week shows what percentage of COVID tests come back positive, saying that the person is infected. Data is from ONS. Note that 2022 starts with the back end of a wave. At the start of the 2022 infections were high but dropping, then there are peaks around March, July and October, before infections start climbing again at the end of the year. So the data are as clear as day, the question is: What is going on? Why the wave every three to four months?
This is not expected, COVID-19 is transmitted in what should be a similar way to flu. Now flu infections also have a period, but that period is the obvious period of 12 months – see earlier blog post. Flu arrives as the days grow short in the autumn, and departs with the arrival of spring.
So a twelve-month period would have an obvious source, but why four months? I don’t think we know. Intriguingly the last major pandemic, in 1918/1919 also had waves of periods less than one year, so there may be a common feature there. There may be several factors behind the waves coming at approximately three-month intervals, possibly including immunity from infection waning after a few months, but basically we are pretty clueless. It would be good to know before we have too many more waves of infection.
