
In August, 27 customers of a branch of Starbucks in South Korea were infected by one person. But none of the mask-wearing (it’s company policy*) employees were infected. One event does not provide a whole lot of data but it does allow us to take a stab at estimating how effective masks are. The plot above is an an attempt at that.
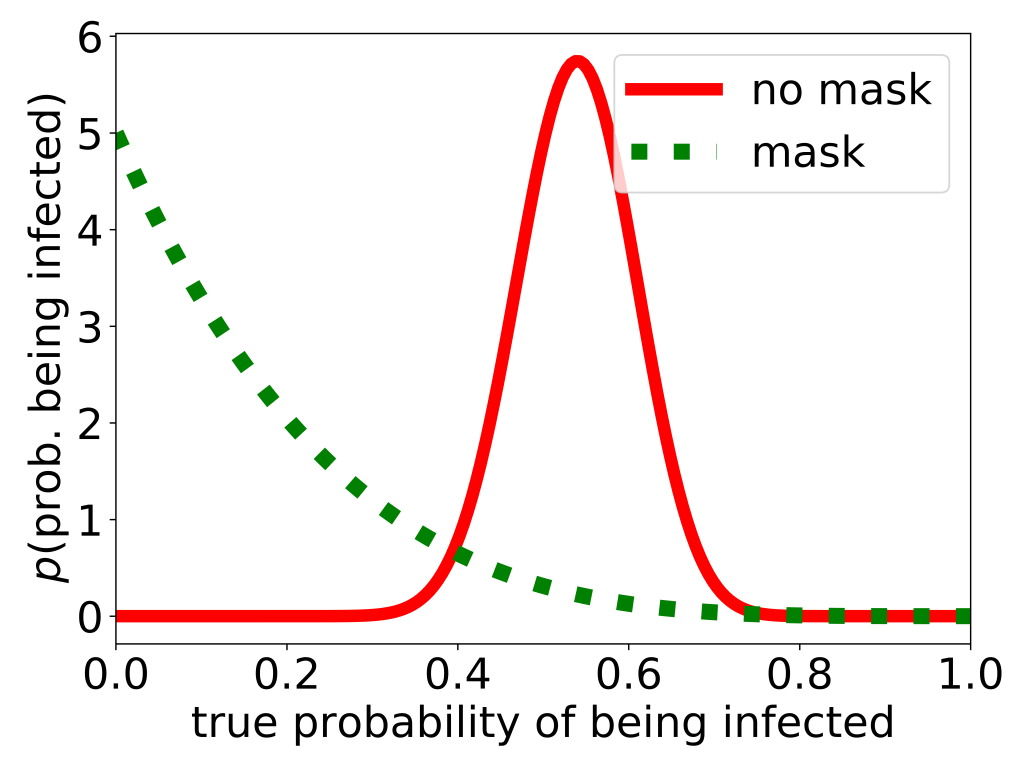
I estimate that over the couple of hours the infected customer was present, effectively 50 people** were there in the coffee-shop, averaged over the two hours the infected person stayed in the coffee shop, and that they were all drinking/eating so not wearing a mask. Then (using Bayesian stats***) I get the red curve as my best guess at what we know about the true probability that if you were there is an unmasked customer, you would have become infected. The red curve has a peak between around 0.4 and 0.7, so I predict that the probability of you becoming infected is probably within that range — provided my guess of 50 customers is close to the truth.
The plot above expresses what I think I know as a probability density function (the y axis of the plot), for the true probability of being infected (the x axis of the plot). So the plot shows the probability that a probability has a certain value. Sorry this is a bit confusing but what we are interested in is a probability: It is the probability that you would be infected if you were in the Starbucks. And as we are uncertain about the true value of this probability, we need a probability density function to describe what we know about this probability. It all gets rather meta when are working with uncertainties about the true value of a probability.
We have even less data on what the probability of becoming infected is when wearing a mask, as there were only four employees. This is why the green dashed curve is far from zero over quite a lot of the x axis. But we see that it is already quite small at a probability of 0.4, so it is very likely that the true probability of becoming infected if you wear a mask is less than 40%.
The red and green curves have relatively little overlap, so we can conclude that the data provides pretty strong evidence for wearing a mask reducing the probability of becoming infected. The data from this outbreak in a Starbucks strongly suggest that you should wear a mask. But note that although none of the four masked employees caught COVID-19, it does not prove that a mask provides complete protection.
* I have read that the masks work may be the fancy ones more normally worn by health-care workers, as opposed to the cotton or surgical masks that are more common, but I don’t know if this is true.
** The true number could be lower or higher than 50, which introduces a systematic error which would shift both curves up or down, respectively.
*** I used Bayesian statistics and started from a position of complete ignorance, i.e., assumed at the start that the probability of being infected could be anything from 0 to 1, both with an without a mask. This is what is called the prior in Bayesian statistics. Then all I need is the binomial distribution to give the me the probability density for the number of infections as a function of the true probability of becoming infected. I actually teach what is mathematically exactly the same problem to second year students.
