 The modern way to measure the performance of universities, departments and academics, is via metrics, i.e., numbers, as opposed to qualitative opinions of peers in the field. All sorts of numbers are available nowadays, and these numbers are much much faster to work with than getting an expert opinion. They can be used by managers who don’t have the expertise to assess the quality of research, and by academics who don’t have the time. And you need numbers to compile league tables, which are very popular.
The grand daddy of these metrics is the Journal Impact Factor (JIF), which celebrates its 45th birthday next year. The JIF was developed to measure the quality of a journal (not that of an individual academic or university). The JIF for a given journal for a given year, is the number of citations in that year, to papers published in that journal over the previous two years.
For example, in the years 2013 and 2014, the journal Nature published a total of 1732 research articles. In the year 2015, these articles were cited a total of 52,002 times. This gives Nature an JIF of 57,700/1,732 = 33. So the JIF is just the average (measured by the arithmetic mean) number of citations of a paper. Citations are taken as a measure of quality: if you published dull work that nobody cares about then nobody will cite you, but if your work sets the world on fire, people will cite you.
And JIF is a not unreasonable metric for a journal. Nature has a big JIF, that for PLOS One, for example, is about ten times smaller. On average, papers in Nature have more impact than those in Physical Review, so if you want to rank journals by a measure of the average impact of their papers, you could use JIFs and Nature would be higher than Physical Review.
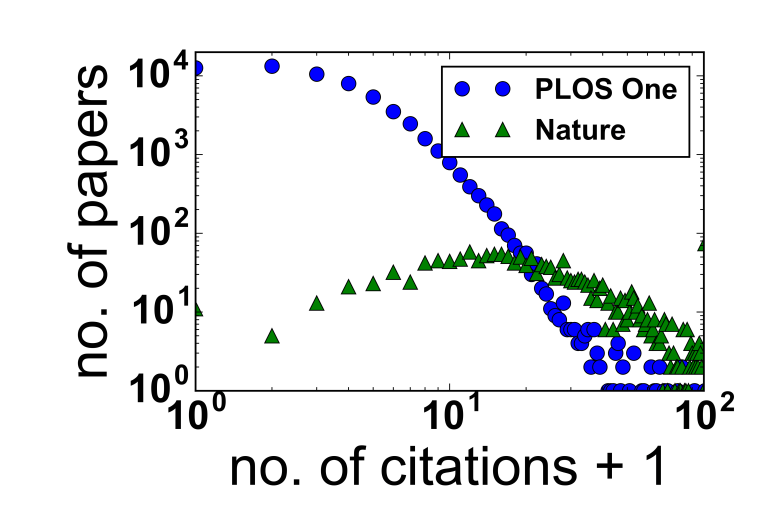
This is all relatively uncontroversial. What is controversial is the use of JIF to rank individual articles and researchers. Hence a recent bioRxiv preprint by Bolognesi et al. They are unhappy with the use of JIFs to rank individual articles and researchers. The plot above shows why*. The green circles show the number of papers published in Nature in 2013 and 2014 as the y coordinate and the number of citations (plus one so it fits on a log-log scale plot) as the x coordinate.
The point is that the distribution is very wide, the most probable values are between around 10 and 20 citations for a paper, but some papers are not cited at all, and some are cited much more than 20 times. The mean value of 33 is a poor way to characterise such a broad distribution.
The situation is even worse for other journals, for example for a biology journal called PLOS One, the papers for this journal are shown as the blue circles.Here many papers are either not cited at all or cited only one or a few times, but are a few are cited tens of times. PLOS One’s JIF of 2.8 does not capture this broad range.
Using JIF to rank an individual article is a bit like extrapolating from the fact that on average people in the UK earn more than people in Greece, to assume that if you meet a UK-based and Greece-based person, the guy in the UK must have more money. More often than not this will be true, but a significant minority of the time, it will be wrong . Because of this, I agree with many others in thinking JIF should not be used on its own to make decisions with consequences.
* This plot uses data from the spreadsheet in their Supplemental File 1, and plots it as Bolognesi et al. do in their figure 4.

1 Comment