The standard way of studying the structures of crystals on atomic lengthscales, is X-ray diffraction. We fire X-rays at a sample and then detect the X-rays that bounce off the sample, as a function of the angle X-rays come out. This gives us what is called a structure factor, S(k), where k is called the wavector, which has dimensions of inverse length, i.e., m-1.
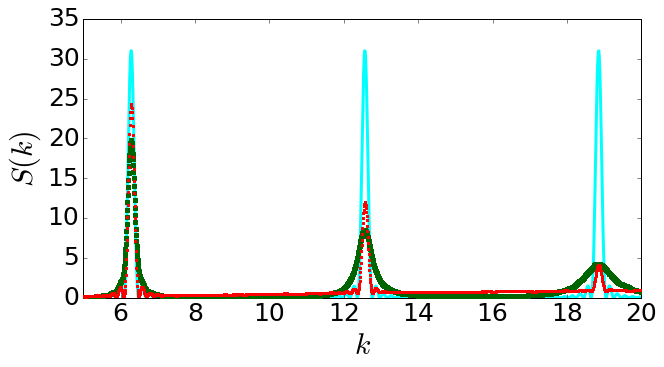
Above are calculations for a toy model (one-dimensional) crystal, with atoms spaced on a lattice with a spacing between one atom and the next of one unit (i.e., I am working in units of the lattice spacing, typically a few tenths of a nanometre, not metres, for simplicity). For an infinite perfect crystal, the Platonic ideal of a crystal, the structure factor is a series of spikes (called delta functions) at 2π (~6.3), 4π (12.6), 6π (18.9), etc.
Now, often, for example in some substances people want to make cheap solar panels out of, the crystals are not infinite but only perhaps tens of atoms across. Then the peaks are still quite sharp but are not simple spikes. The structure factor for a perfect crystal of 31 layers is shown by a cyan curve above. Note that each of the three peaks is the same height, and that the peaks are all the same width. The width is about 2π /31, i.e., inversely proportional to the size of the lattice.
Real crystals are not of course perfectly periodic. The atoms of each crystal will be moving around due to their thermal energy, they may also be defects. These defects can really affect the properties, e.g., in a solar panel, so people are really interested in them. Above, there is a red dashed curve, that shows what happens when the lattice still repeats perfectly across the 31 layers in the sense that there is no average drift away from the spacing of one unit, but where each atom is little off to the left or to the right.
The only difference between the cyan and red curves is that the red peaks are lower than the cyan peaks by an amount that becomes larger and larger as we go from the first to the second and then to third peak. This sort of noise, basically just flattens the peaks at large values of k.
But what if successive layers do tend to drift away from the period of the perfect crystal, this is a different sort of noise, and its consequence is shown in the green curve. Just as with the red curve, the peaks at high k are flattened. But there is also a new effect, the peaks also become broader and broader as k increases.
Crucially, this broadening is different from the broadening due to the small size of the crystal. Broadening due to small crystal size affects all peaks equally, that due to noise in the positions of the atoms that breaks the periodicity, broadens the peaks at high k much more.
In a toy model this is very clear and neat, size and noise in the atom positions have affects that are easily distinguished. Apart from being kind of interesting, a group in Stanford is pushing using this idea on real X-ray patterns, to infer not just how bad their crystals are but how they are bad: Are they really tiny, or a bit bigger but with a messed up lattice? Real crystals are a lot more complex than my toy model, so it is a bit hard to see how well it works, but it is a nice idea.
