Next week is the last teaching week of this semester. I have been revising almost from scratch both of my second year courses, which at times has taken most of my waking moments. Most of my teaching is this semester, so I have been crazy busy. But I have had time to add a small new bit to my final-year biological physics course. This is on the fact that many aspects of our bodies, and the diseases that afflict them, are controlled not by a single gene, but by many.
Our height is the classic example, whether we are short, tall or average is the cumulative result of many of the genes we inherit from our parents. A less cheerful example is cancer. There is evidence that in most cases multiple mutations in multiple genes are needed to drive cells to become cancerous. There is relatively direct molecular evidence for this, but there is also the fact that most cancers are diseases of old age.
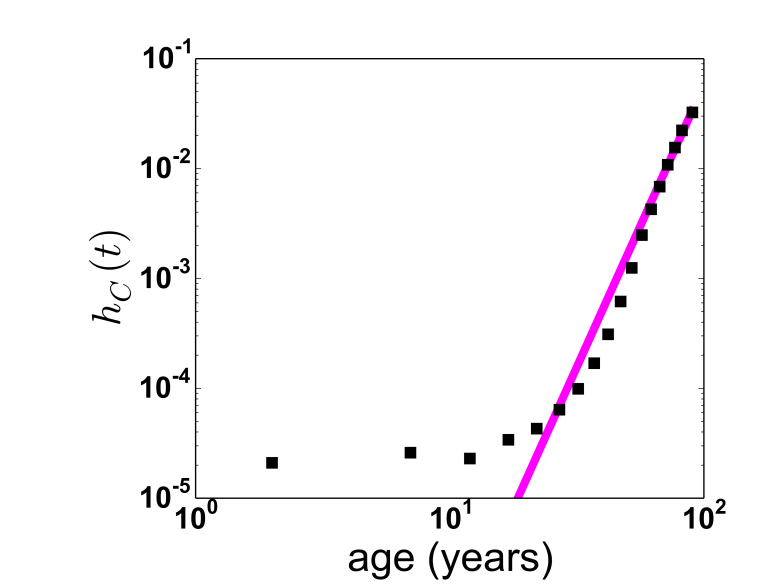
This is shown in the plot above of mortality (death) rates from cancer, of males, as a function of age. The plot uses data I got from the Cancer Research UK site, who in turn got it from the Office of National Statistics. I call his hC(t). Note that it is on a log-log scale, i.e., both axes go up in factors of 10. The data is plotted as squares. This includes deaths from all forms of cancer.
The log y axis shows us how big the range of mortality rates is. It varies from around 1 death per 100,000 males per year for children and young adults, to a few deaths per 100 men per year for men in their 80s, i.e., mortality rates increase by a factor of a thousand. The plot for females is similar. The steep rise that total risk of the 26 students in the class is only a few times higher than mine.
Cancer is a complex disease, and different cancers behave in different ways. But note that the straight magenta line fits the data pretty well for rates above about 1 in 1000, which is for around ages a bit more than mine, and older. Straight lines on log-log plots are the signature of power laws, i.e., for tx, for x some number, here around 5.1.
When cancer rates are high the rate increases approximately as a power law of time. Power laws can result from multistep processes, i.e., if cancer is a result of n mutations, then the cancer rate can be shown to vary roughly as tn-1, so the data at older ages is consistent with the cancers being on average about a 6-step process. The figure of 6 is a very rough estimate, but indeed it appears that several mutations are needed in several genes to cause cancer.
