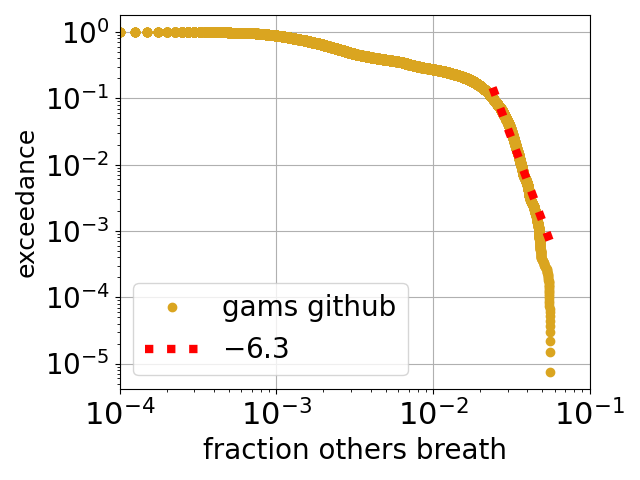
Above is plotted a slightly odd function called an exceedance, the y axis is the probability that the value on the x axis is exceeded. The data is from a large dataset of measurements of indoor air by a Chinese company called gams Environmental Monitoring*. The x axis is the estimated** fraction of air in the room that is second hand, i.e., has been breathed out by another person (or by you). For example, the probability is close to 0.1 = 10% for a value along the x axis of 0.03 = 3 %. So, for this dataset, about 10% of the time the room air is at least 3% second hand. Another way of approaching is to say that the median fraction of the air that is second hand is around half a %.
The fraction second hand matters because if someone is infected with COVID, the virus may be in their breath and so in the second-hand fraction. The second-hand air in a room is the dangerous fraction of the air. For COVID (or flu …) transmission we are interested in the right-hand part of the plot, where the fraction is highest.
Above, I have fit the top 10% tail of the data with a power law function – plotted as a dotted red line (NB graph is log-log so power laws are straight lines). It is not a great fit but equally it is not disastrous. Notable is the large negative exponent of −6.3. The exceedance decays rapidly with the fraction of second-hand air, i.e., as we go to fractions of second-hand air of a few % and above, the probability of breathing in this much second-hand air decreases very rapidly.
The exceedance for the amount of virus in an infected person’s saliva can also be plotted**:
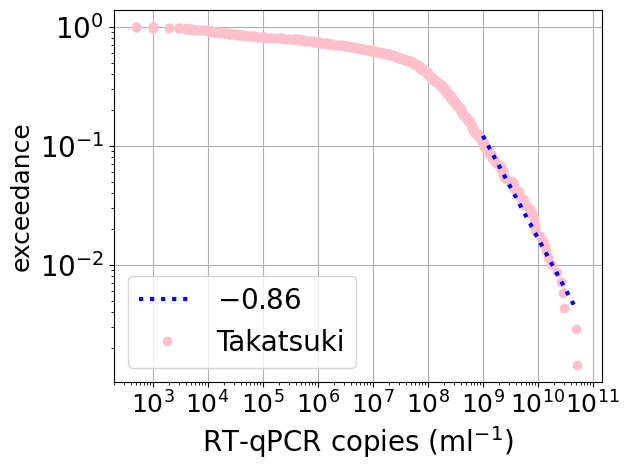
Here RT-qPCR approximately measures the number of copies of a gene of the virus that causes COVID per millilitre of saliva, which is roughly the concentration of virus. Data is from Takatsuki and coworkers. Again I have fit a power law to the tail of large values. It is a bit better fit, and note the much smaller exponent (= slope on these log-log plots). The slope is only −0.86, not the −6.3 we saw for the fraction of second-hand air. This is consistent with the much smaller range of values for the fraction of second-hand air. For air the dynamic range is 103 (from around 10-4 to 0.1), while for the viral concentration data the range 108 (from 103 to 1011).
The amount of virus (as measured by PCR) is much more variable than the fraction of second-hand air in rooms that gams Environmental Monitoring has data for. This may mean that any variability in the risk of infection is dominated by the variability in how infectious the infected person, with the variability in other factors such as room ventilation, having smaller effects. Maybe.
* Data is on github here. It was more-or-less first data set I found on Googling, there are may be better ones, although it is quite big, around 135,000 measured CO2 values. The dataset was uploaded to github by Jerry Liu.
** Estimation is done based on what the dataset measures, which is room CO2 levels. As atmospheric (ie first hand) air has about 400 ppm (parts per million CO2) while our breath is about 40,000 ppm, the fraction second hand can be estimated from the room CO2 ppm by subtracting 400 and dividing by 40,000.
*** See earlier post for some background.

1 Comment