This post is, basically, a part II to the previous post on the study of Brock et al. on the effect of installing room air filters, on COVID transmission in hospitals. Brock et al. found that the air filtering “was associated with a non-significant trend of lower hazard for SARS-CoV-2 infection”. The “non-significant” here is a bit sad. The study was of a total of 229 hospital-acquired infections and the conclusion was that this number is too small to draw a definite conclusion. So, how big a study do you need to come to a definite conclusion?
This depends on how big the affect of ventilation is. Which we don’t know. We have a guess at the dose-response curve, which is that the probability of infection increases as approximately the square root of the dose. So if an intervention, here air filtration, reduces the dose by a factor of r, then the change in number of infections is approximately N(1-1/r0.47), where N is the number of infections without the dose reduction. Or if there are multiple pathways intervention and an intervention affects a fraction f of the transmission the change is Nf(1-1/r0.47).
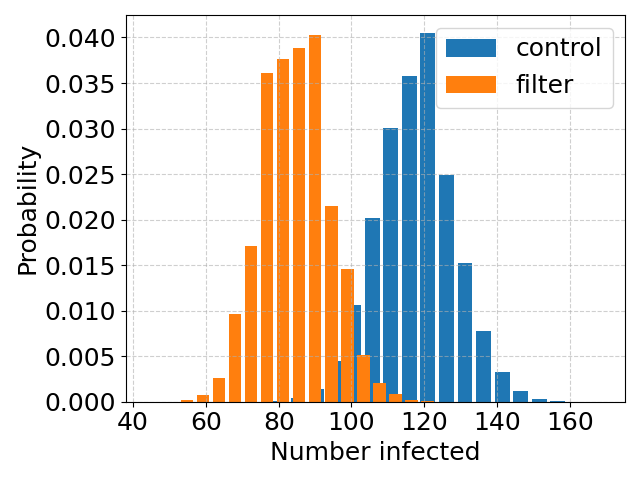
I guesstimate that that the air filtration in the Cambridge hospital wards reduces the dose by about a factor of 3*, and the the transmission is say 70% over the room air**. This gives a reduction by a fraction 0.7*(1 – 1/30.47) = 28% . Up top* are plots of histograms of simulations of many samples of the two cases, the first with a mean number of 120 infections (blue) and the other with 28% less.
Note that the two histograms overlap – this number of infections is not enough to reliably separate the two cases, with and without filtration. Below*** is the case with 4 times as many infections.
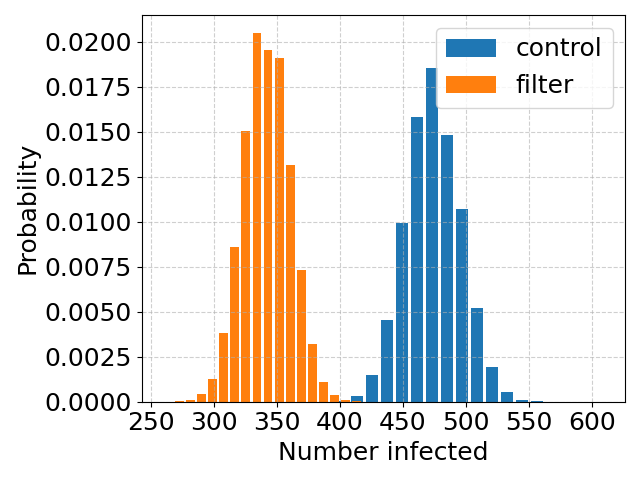
Now the histograms have very little overlap***. If indeed, filtering the air reduces the infection rate by around 28%, then a study 4 times as large should be big enough to give a definite answer.
* This factor of 3 assumes that the air filtration effectively triples the rate of turnover of the air, effectively halving the concentration of virus in the air, which would be consistent with results for filtration of general aerosols, found by the same group a little earlier.
*** Transmission is complex and there are multiple possible mechanisms. It seems very likely that for COVID transmission is largely (say 90% plus) over the air, with only a small part via, for example, surfaces. But that transmission across the air can be roughly divided into “short range” and “long range”. Here “long-range” transmission means infections are due to well-mixed air from the room being inhaled by a susceptible patient. This is as opposed to “short range” transmission, which would be via say an infected healthcare worker being close to, and perhaps speaking directly to, a patient, so that the patient is partially breathing air that the healthcare worker has just breathed out. This air has not had time to mix in with room air and be filtered. I assume (rather arbitrarily) that transmission is 70% long range.
*** (rough!) code to compute figures here.
**** The fractional width of the histograms scales as 1/N1/2, so the larger the number of infections, the narrower the histogram and the more accurate a study is at assessing the true rate of transmission.
