Although good systematic data are lacking there are observations of what are called superspreading events. These are single events at which many people become infected. An example from early in the COVID pandemic is the superspreading even at a choir practice in Skagit Valley (USA) where it is likely that 53 attendees were infected in one event. Transmission is a random process. So just by chance we expect sometimes one person becomes infected at an event, sometimes by chance two or three, or …. So we always would expect at least some superspreading events. But how many?
The more-or-less standard statistics of the distribution of the number of things – here the number of people infected – is the famous Poisson distribution. This gives the expected number of events that happen when these events occur with: a) a well-defined rate, and b) each transmission to a susceptible person is independent of the others.
The Poisson distribution has a number of characteristic features. One of which is that it is a relatively narrow probability distribution, where “relatively narrow” means that the ratio between the standard deviation and the mean is equal to one over the square root of the mean.
The assumption underlying the Poisson distribution that the rate is well defined may not be sensible here. The rate of COVID transmission presumably* depends on the amount of virus in the infected person (= viral load), and this amount can vary by factors of a million or more, from one infected person to another. So the rate may vary* by orders of magnitude. And if that is true then the statistics for the number of people infected in one go, may no longer obey Poisson statistics.
To see if this was right I started with a distribution of viral loads plus a functional form for how the probability of infection depends on this viral load (from data on infecting cells in cell culture, not us, see earlier post). I then computed the distribution of the number of people infected, in a set of rooms all containing 50 susceptible people plus one infected person.
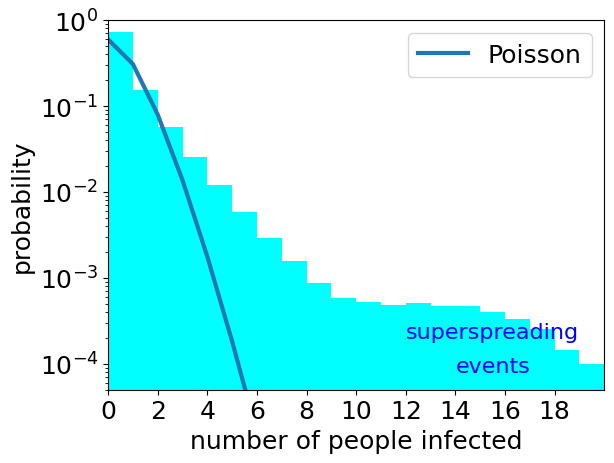
The results are plotted above as the cyan histogram. For comparison, a Poisson distribution with the same mean (approx 0.5) is also plotted.
Note that the histogram is very far from the Poisson distribution with same mean. Poisson distributions with a mean of 0.5 have very low (much less than one in a million) probabilities of 10 or more events. But the actual distribution in cyan is much much broader. With much higher (but still quite low, at less than one in a thousand) probabilities than more than 10 people are infected.
There is no simple definition of what a superspreader event is. But for COVID, one infected person goes on to infect roughly 2 to 3 others on average (if no precautions are taken). For an event to be classed as a superspreader there should several times this number infected. So say around say 8 or more people infected is a superspreading event. It is clear from the plot above, that the number of superspreading events is orders of magnitude larger when the infectiousness of a person varies over a wide range, than is predicted by Poisson.
So for a disease where one infected person typically only passes it on to a few others, superspreading events in which tens of people become infected may only be possible if infectiousness varies a lot from one person to another.
* We have no direct data on whether the transmission probability of an airborne disease such as COVID varies from one infected person to another.
