The title seems a reasonable question to ask. If you are pretty close to someone and talking to them, then you are facing them and so more-or-less in the direct path of their exhaled breath. A single exhaled breath contains very roughly of order a few hundred aerosol droplets* (typically all of which are so small they are invisible). Depending on how close you are to someone you are talking to, the air you are inhaling may contain say 1 to 10% air they have breathed out. At a breath every few seconds then during a chat with someone you could inhale anywhere between tens and many thousands of tiny droplets that they have exhaled – a perhaps unattractive thought but this is what happens when we share the air with fellow humans. Something, we as social creatures, do a lot.
As a very rough number, let us assume you inhale 100 of the infected person’s droplets, and that these droplets have an average diameter of 2 micrometres. The dataset of Jaafar and coworkers (used in the previous post) includes a distribution of viral loads – as measured by qPCR. Assuming that their swabs had a volume of order a microlitre and that the viral concentration in these swabs is representative of that in aerosol droplets in someone’s breath, we can estimate how much virus you should inhale if you inhale a hundred droplets from an infected person.
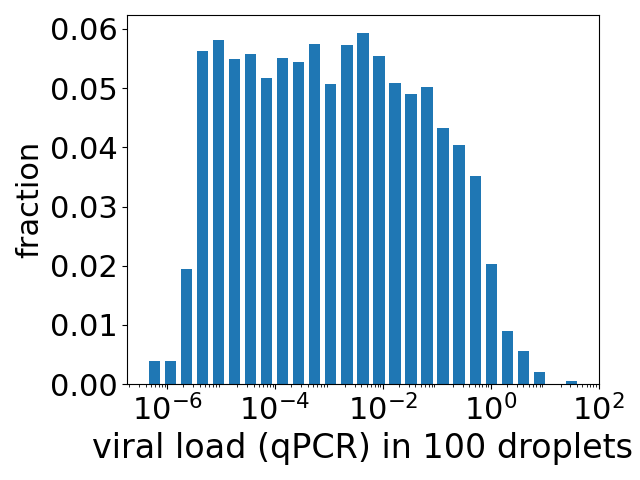
Some infected people have concentrations (qPCR measured) a million times higher than others. This variability translates into a huge spread of possible expected mean number of viruses inhaled, if you inhale 100 droplets. The height of each bar in the plot at the top is the fraction of people who have a viral load such that 100 aerosol droplets contain (on average) the number of viruses given by the value along the x axis. For example, the bar at a value of 1 (=100) has a height of 0.02, i.e. 2% of the population of infected people have enough virus in the saliva so that the 100 droplets contain an average of 1 virus.
This is towards the right of the distribution, and note that the x axis is a log scale. Many fractions of the population have such low concentrations of virus (and aerosol droplets are so small), that 100 droplets contain an average of 10-4 or 10-6 .or .. viruses. Here an average of 10-4 means in effect about one chance in 10,000 that the 100 droplets contain a single virus, with 9,999 chances that the droplets do not contain a single virus.
So it is very likely that you will not inhale a single virus and so not become infected. But can we estimate what is the probability that you do become infected? Yes we can. We can estimate this using the probability of infection as a function of viral load, from the previous post. As we are assuming that each swab in the study of Jaafar and coworkers is about a microlitre, the plot in the previous post is essentially a plot of probability of infection as a function of the number of viruses – although we should remember that this is for the infection of cells growing in cell culture. We have to take the big step of assuming that we can use this probability of infection to estimate the probability of infection of a human.
If we do, then we simply multiply the bars above by the probabilities of infection from the previous post and sum, to get a probability of infection of order 1%. Our very rough estimate is that a chat with an infected person results in about a 1% chance of infection. Now this relies on many assumptions, such as extrapolating from saliva swabs to saliva aerosol particles, and Jaafar et al.‘s study was early on the pandemic, pre-vaccination. If you are vaccinated this will reduce the probability of infection.
A final comment is that we can break down this 1% chance of infection into its contributions from people with varying levels of virus:
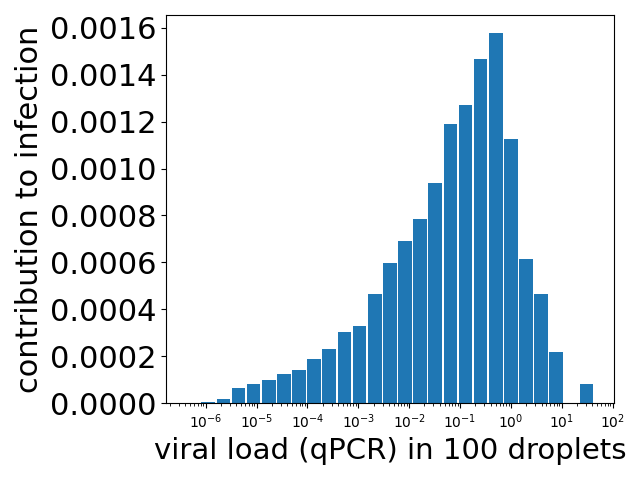
Unsurprisingly, the contribution from the fractions of people with little virus in their system is very low. But note that the contribution peaks for people with enough virus in their system so that the 100 droplets have around 0.1 to 1 viruses. The contribution then drops off because although the probability of infection is still increasing, the number of people with viral loads this high is dropping rapidly. This is the drop off seen in the plot at the top of the post.
The 1% risk should be taken with a fair bit of salt. But it does not look crazy, and it does tell us something, not least what we need to measure to do better.
* The number of aerosol droplets we exhale varies a lot from one person to another, for reasons I am not sure we understand. See for example Figure 1(a) of the work of Tian et al..
