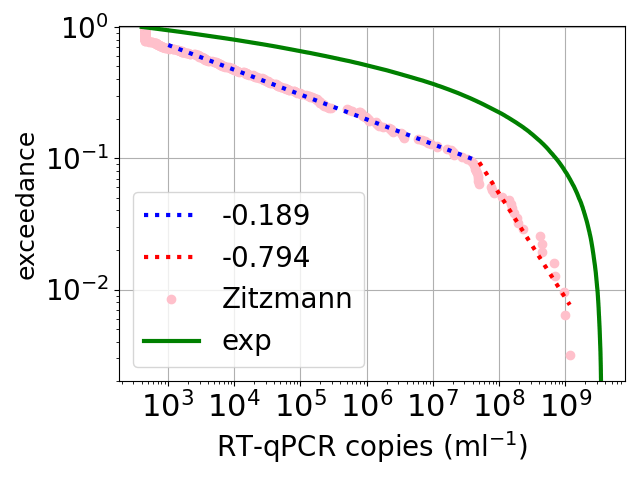
The plot of the distribution of SARS-CoV-2 viral loads, in infected people. SARS-CoV-2 is the virus that causes COVID. The x axis is the estimated number of viruses per millilitre of mucus, in a sample taken from an infected person. The y axis is the exceedance, which is the fraction of the samples that have a viral load larger than the number along the y axis. So for example, for a viral load around 3 * 107 virus/ml, the exceedance is 0.1, so 10% of the patients had more than 3 * 107 virus/ml. Note that the range of viral loads spans a range of over a million.
The pink points are data from Zitzmann and coworkers. There are also two power law fits. For reasons I do not understand, the data is very well fit over 4 orders of magnitude by a power law with a small exponent around -0.2.
So I do not understand the functional form. But the large range is maybe easier to understand. As Zitzmann and coworkers show both the growth of the viral load – as the virus takes hold and the infection increases – and the fading of the infection – as presumably the person’s immune system takes hold – look exponential. And if you sample from an exponentially increasing function – this is the green curve – then you easily get a large dynamic range. So the large range looks easy to understand, but the functional form of the data and the sample from an exponential, are rather different. So, work to do.
